

What Are the Types of Business Analytics?
Business analytics is not one single skill. It is a set of approaches, and each one helps a company answer a different kind of question about its data. Some look back at what has already happened. Others look ahead and guide what a business should do next.
When you know the types of business analytics helps you understand how companies actually use data, and it shows you which skills to learn first if you want to build a career in this field. In this, we will go through each types of business analytics:
What Is Business Analytics?Business analytics is the practice of using data to understand how a business is performing and to make better decisions. It combines data, statistics, and technology with business knowledge to turn raw numbers into advice a company can act on.
The types of analytics are best understood as a ladder. At the bottom, you look back at what happened. As you climb, you move toward predicting the future and deciding what action to take.
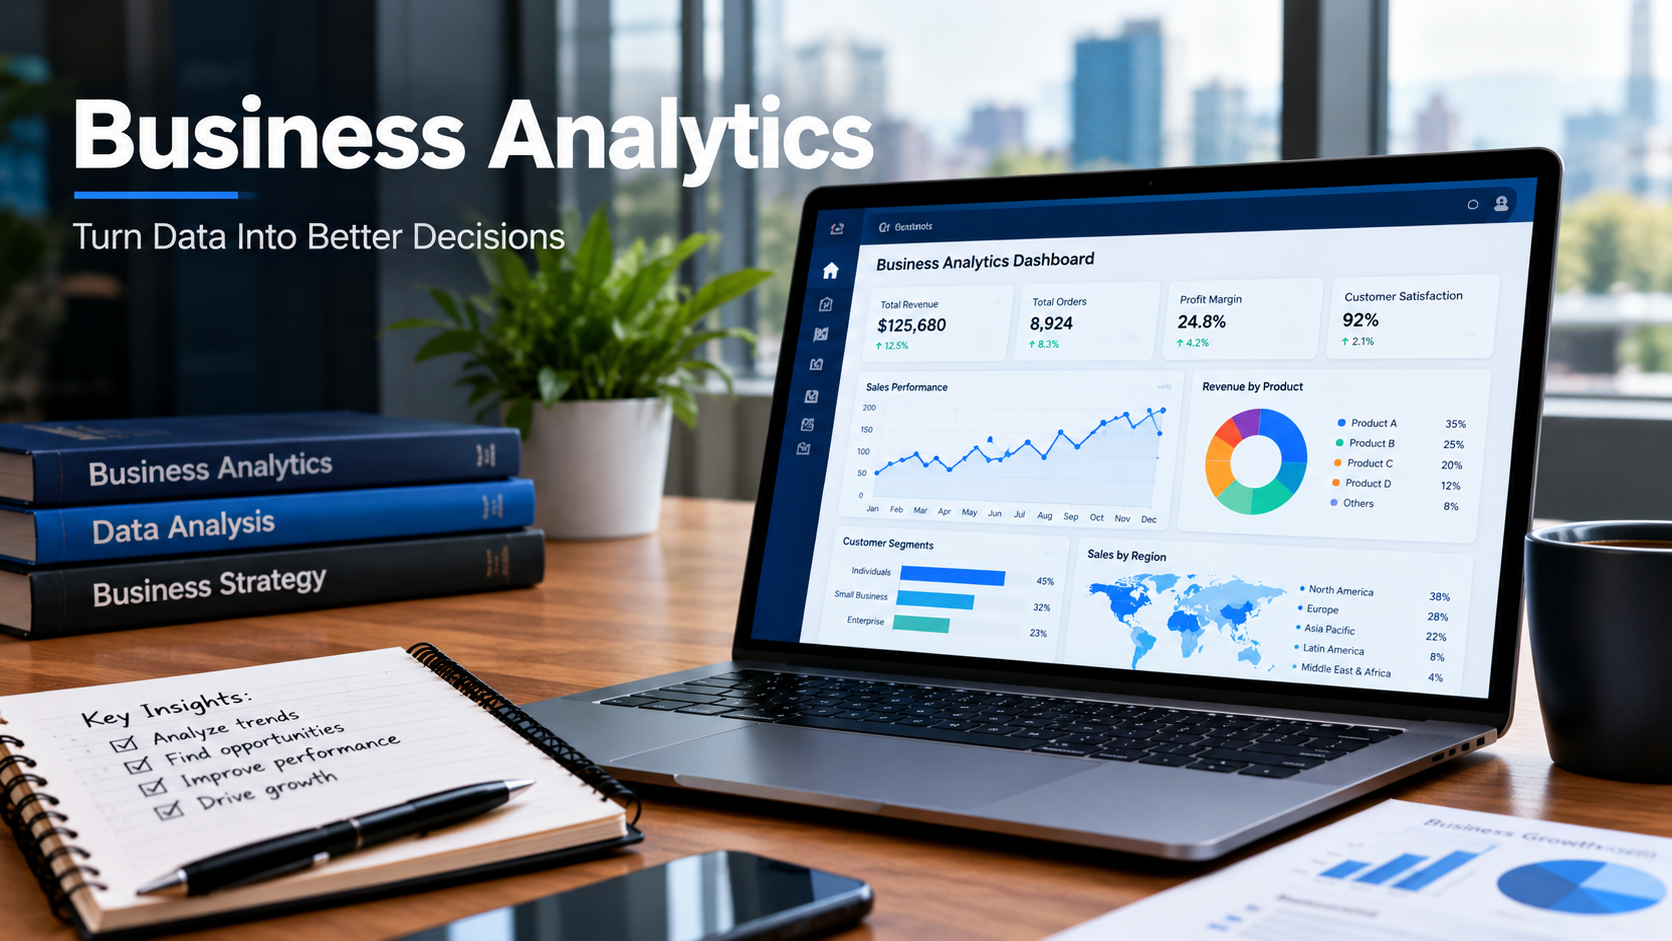
1. Descriptive Analytics: What Happened?Descriptive analytics is the starting point, it summarizes past data so that people can see what has happened in the business.
What it does: It collects and organizes historical data into reports, charts, and dashboards.
Example questions:
How much revenue did we make last quarter?Which product sold the most last month?How many people visited our website this week?Common methods and tools: summaries, averages, totals, percentages, trend charts, and dashboards in tools like Excel, Power BI, and Tableau.
Real-life example: A retail company reviews a monthly dashboard showing sales by region, top-selling products, and number of returns.
Strength: It gives everyone a shared, clear picture of reality.
Limitation: It tells you what happened but not why, and it cannot tell you what comes next.
Most businesses spend a large share of their analytics effort here, and that is perfectly fine. You cannot solve a problem you cannot see.
2. Diagnostic Analytics: Why Did It Happen?Once you know what happened, the natural next question is why. Diagnostic analytics digs into the data to find the causes behind a result.
What it does: It compares data, drills into details, and looks for patterns and relationships that explain a change.
Example questions:
Why did sales drop in one city?Why did customer complaints rise last month?Why did the new campaign work better in one age group?Common methods and tools: drill-down analysis, segmentation, comparing time periods, correlation analysis, root cause analysis, and SQL queries to slice data in different ways.
Real-life example: A food delivery company sees repeat orders fall. By breaking the data down, the analyst finds that the drop is concentrated in orders with delivery times above 45 minutes, pointing to a delivery problem instead of a menu problem.
Strength: It turns a vague worry into a specific, fixable cause.
Limitation: It explains the past. It does not forecast the future. And correlation is not always causation, so analysts must be careful about the conclusions they draw.
3. Predictive Analytics: What Is Likely to Happen?Predictive analytics uses historical data to estimate what may happen in the future. It does not offer certainty, but it gives probabilities and forecasts that help a business plan.
What it does: It finds patterns in past data and uses them to make informed predictions.
Example questions:
How much will we sell next quarter?Which customers are most likely to stop using our service?Which leads are most likely to buy?Common methods and tools: forecasting, regression, classification models, and machine learning, often using Python or R along with statistical techniques.
Real-life example: A telecom company builds a model that flags customers likely to cancel their subscription, so the retention team can contact them early with an offer.
Strength: It lets businesses prepare instead of reacting.
Limitation: Predictions are only as good as the data behind them. Sudden changes in the market, like a new competitor, can make forecasts less reliable. Models also need regular checking and updating.
4. Prescriptive Analytics: What Should We Do?Prescriptive analytics sits at the top of the ladder. It goes beyond predicting what might happen and recommends the best action to take.
What it does: It combines predictions with business rules, constraints, and goals to suggest decisions.
Example questions:
What price should we set to maximize profit?How should we schedule deliveries to save the most time and fuel?How should we split our marketing budget across channels?Common methods and tools: optimization, simulation, decision modeling, and advanced machine learning, often built into specialized software.
Real-life example: A logistics company uses prescriptive analytics to pick the most efficient delivery routes each day, taking into account traffic, vehicle capacity, and delivery deadlines.
Strength: It moves from insight to action, which is where the biggest business value usually lies.
Limitation: It is the most complex and demanding type. It needs good data, strong technical skills, and clear business goals. Human judgment is still needed to review the recommendations.
How the Types Work TogetherIn real businesses, these types are not separate silos. They flow into each other. A single project might look like this:
Descriptive: Sales fell 10% last quarter.Diagnostic: The drop is mostly among first-time customers in two cities.Predictive: If nothing changes, the decline is likely to continue next quarter.Prescriptive: Run a targeted offer in those two cities and increase ad spend on the best-performing channel.Seeing the full chain is what separates a good analyst from someone who only builds reports.
Learn All Four Types the Practical Way: WsCube Tech’s Business Analytics CourseUnderstanding the types is one thing, practicing them on real business problems is how the skills stick. The Business Analytics Course from WsCube Tech ↗ is a 14-week live online program with 106+ hours of sessions, followed by a 4-week online internship.
The curriculum covers:
Business strategy and metrics: systems thinking, user research, requirements gathering, product metrics, funnel and cohort analysis, and A/B testing.Excel: pivot tables, Power Query, and dashboards.SQL (MySQL): joins, subqueries, CTEs, and window functions.Power BI and Tableau: data modeling, DAX, and dashboard building.AI tools used across the analysis workflow, plus bonus modules on statistics and probability, Microsoft Fabric, and Google Analytics 4.You also work on projects and case studies based on companies such as Urban Company, Swiggy, Amazon, and Tata Power, and finish the program with an internship that has you present findings to stakeholders.
ConclusionEach one builds on the last, and together they take a business from simply seeing its numbers to making smarter decisions with them. If you are starting out, learn them in order, practice on real data, and build projects you can show. A structured business analytics course can speed that up, but the habit that matters most is simple: always ask what happened, why, what next, and what to do about it.