Use Gantt chart to Kickstart your Projects like a Boss
A Gantt chart is a graphical tool that visually represents work progress. It is similar to a bar graph. They are a type of diagram used in project management, business, and engineering to visualize the progress of tasks and resources. The primary purpose of using the chart for management is to understand how tasks relate to each other so that effective group workflow can be achieved. They are also used for planning and scheduling to meet deadlines.
Every software involved in the management of projects has a different Gantt chart template.
A Gantt chart is a simple overview of time, with boxes for each project day and lines linking them together. It is one of the online project management tools that help see the entire project at once and plan the work that needs to be done accordingly.
A free Gantt chart software includes many more features apart from managing the work.
Teamgantt
Teamgantt is web-based project management software that enables businesses to create Gantt charts for productivity and management purposes.
Businesses can easily manage their projects by assigning tasks, setting due dates, tracking progress, and analyzing workloads using this software. In addition, this software offers several features that make collaboration between team members more accessible, such as chat, a comment system, and file sharing.
With Teamgantt, users can easily drag and drop tasks, set dependencies, and track progress in a visually appealing way. This makes this tool ideal for businesses that want to manage projects more effectively and improve their workflow.
ClickUp
ClickUp deems itself as an elegant and free Gantt chart software option. It allows its users to schedule, manage dependencies, and prioritize tasks into a project timeline. Its beautiful and swift interface makes it easy to manage projects by creating lists and tasks and following the overall progress of a project.
Several good features and options make it possible to work more efficiently. It offers support at any time. Plus, it has a great design, and it’s focused on Gantt charts rather than any of the other aspects you might consider. There are also other chart options if you prefer to try out something new.
Hive
Hive software recognized the need for an easy-to-use yet powerful and robust Gantt chart tool. The popularity of Hive has led to it becoming one of the most commonly used tools in organizations worldwide. Hive offers users a user-friendly interface that makes creating and managing projects simple.
For a single user, this tool is free. When it comes to usage for the company, some amount is charged.
To use Hive to its full potential, it is vital to know the features and how these charts work, track project milestones, time and costs, etc.
Orangescrum
Orangescrum is software used to create Gantt charts for businesses. It is an efficient and user-friendly tool easily integrated into any existing business workflow.
It helps users visualize their work schedule and track progress towards specific goals, tasks, or objectives. Moreover, the software provides detailed reports that allow managers to make informed decisions about resource allocation and timelines for future projects.
Orangescrum software is available in free and paid versions. The free version is designed for small to medium businesses. The paid version is intended for larger enterprises.
Instagantt
Instagantt’s core function is scheduling and progress management. Still, it makes an excellent place for your team to collaborate on your project, as it makes it easy for everyone to stay informed and up-to-date with everyone’s work.
Its collaborative options allow you to assign tasks to people in your team and for them to receive an email notifying them about the tasks and their descriptions. Also, it makes it possible to leave comments to everyone involved in any assignments or subtasks and attach any information or files worth sharing.
For seven days, this software can be used for free; later, minimal amounts like 5$ and 7$ per month are charged.
nTask
nTask is an efficient time-tracking program that makes creating Gantt charts easy. The program has a user-friendly interface that allows even beginners to start using it immediately. Additionally, it provides detailed reports which will enable managers to understand the status of their projects at any given moment.
The basic plan is free. For adding more features upgrade is required. The benefit of using nTask for creating a Gantt chart for business is that it is straightforward, allowing you to create diagrams quickly, easily, and without any fuss.
Those who have no prior experience creating flowcharts and other graphs can organize using these apps.
There is free Gantt chart software available at no cost, while many provide a free trial or require upgrading later.
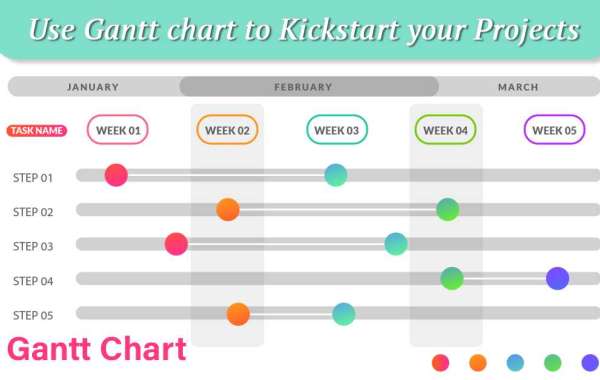
The ideal components of a Gantt chart:
- Gantt chart features are similar in every software, with the minimum difference being in the interface and the appearance of these charts.
- The main elements of a Gantt chart are time (horizontal axis), task (vertical axis), and dependencies (lines connecting tasks).
- The time axis is usually represented in minutes or hours. It shows the sequence in which tasks need to be completed.
- The dependencies axis shows how tasks need to be completed for the project to succeed.
By looking at the chart, it is easy to comprehend its functions if they are correctly labeled.
Hence, project management has witnessed a new turn in improving productivity, expanding team collaboration, and rising progress by using this chart.


